.svg)

TL;DR
- In climate science, "pre-industrial" refers to the 1850–1900 period, a practical proxy for the climate before large-scale fossil fuel use, when CO₂ was ~280 ppm, versus 420+ ppm today.
- We're already ~1.1–1.2°C above pre-industrial levels, leaving an extremely tight carbon budget to stay within 1.5°C, which means your company's reduction targets, SBTi submissions, and CSRD disclosures must explicitly reference this baseline.
- The pre-industrial frame isn't perfectly defined, but you can de-risk greenwashing by clearly stating which baseline (e.g., IPCC 1850–1900), pathway, and scenarios underpin your targets and claims.
- Because we've overshot pre-industrial CO₂ by 50%, 1.5°C-aligned strategies require deep value-chain decarbonisation first, then only high-quality, well-documented carbon credits for a small residual footprint.
Pre-industrial in climate science: the baseline you're measured against
Every time you reference a 1.5°C target, submit an SBTi validation, or explain your net-zero roadmap to the board, you're implicitly anchoring to a baseline: pre-industrial levels. In climate science, this term refers to the average global temperature and atmospheric greenhouse gas concentrations before large-scale fossil fuel burning took off. The IPCC and Paris-aligned frameworks operationalise this as the 1850 to 1900 period, chosen because it's the earliest interval with near-global temperature observations and maintains consistency across assessments.
Why does this matter for your day-to-day work? Because every degree of warming, every carbon budget, and every regulatory expectation flows from this reference point. When you say your targets are "compatible with limiting warming to 1.5°C above pre-industrial levels," you're signalling alignment with a specific, measurable baseline that auditors, investors, and regulators all understand.
Time period and pre-industrial level temperature
The IPCC uses 1850 to 1900 as the pre-industrial baseline because it balances data availability with the representativeness of the pre-fossil-fuel era. Conceptually, "pre-industrial" means before widespread industrialisation, often pegged to around 1750. But instrumental climate records only become reliable and near-global from the mid-19th century onward, so 1850 to 1900 serves as the practical proxy.
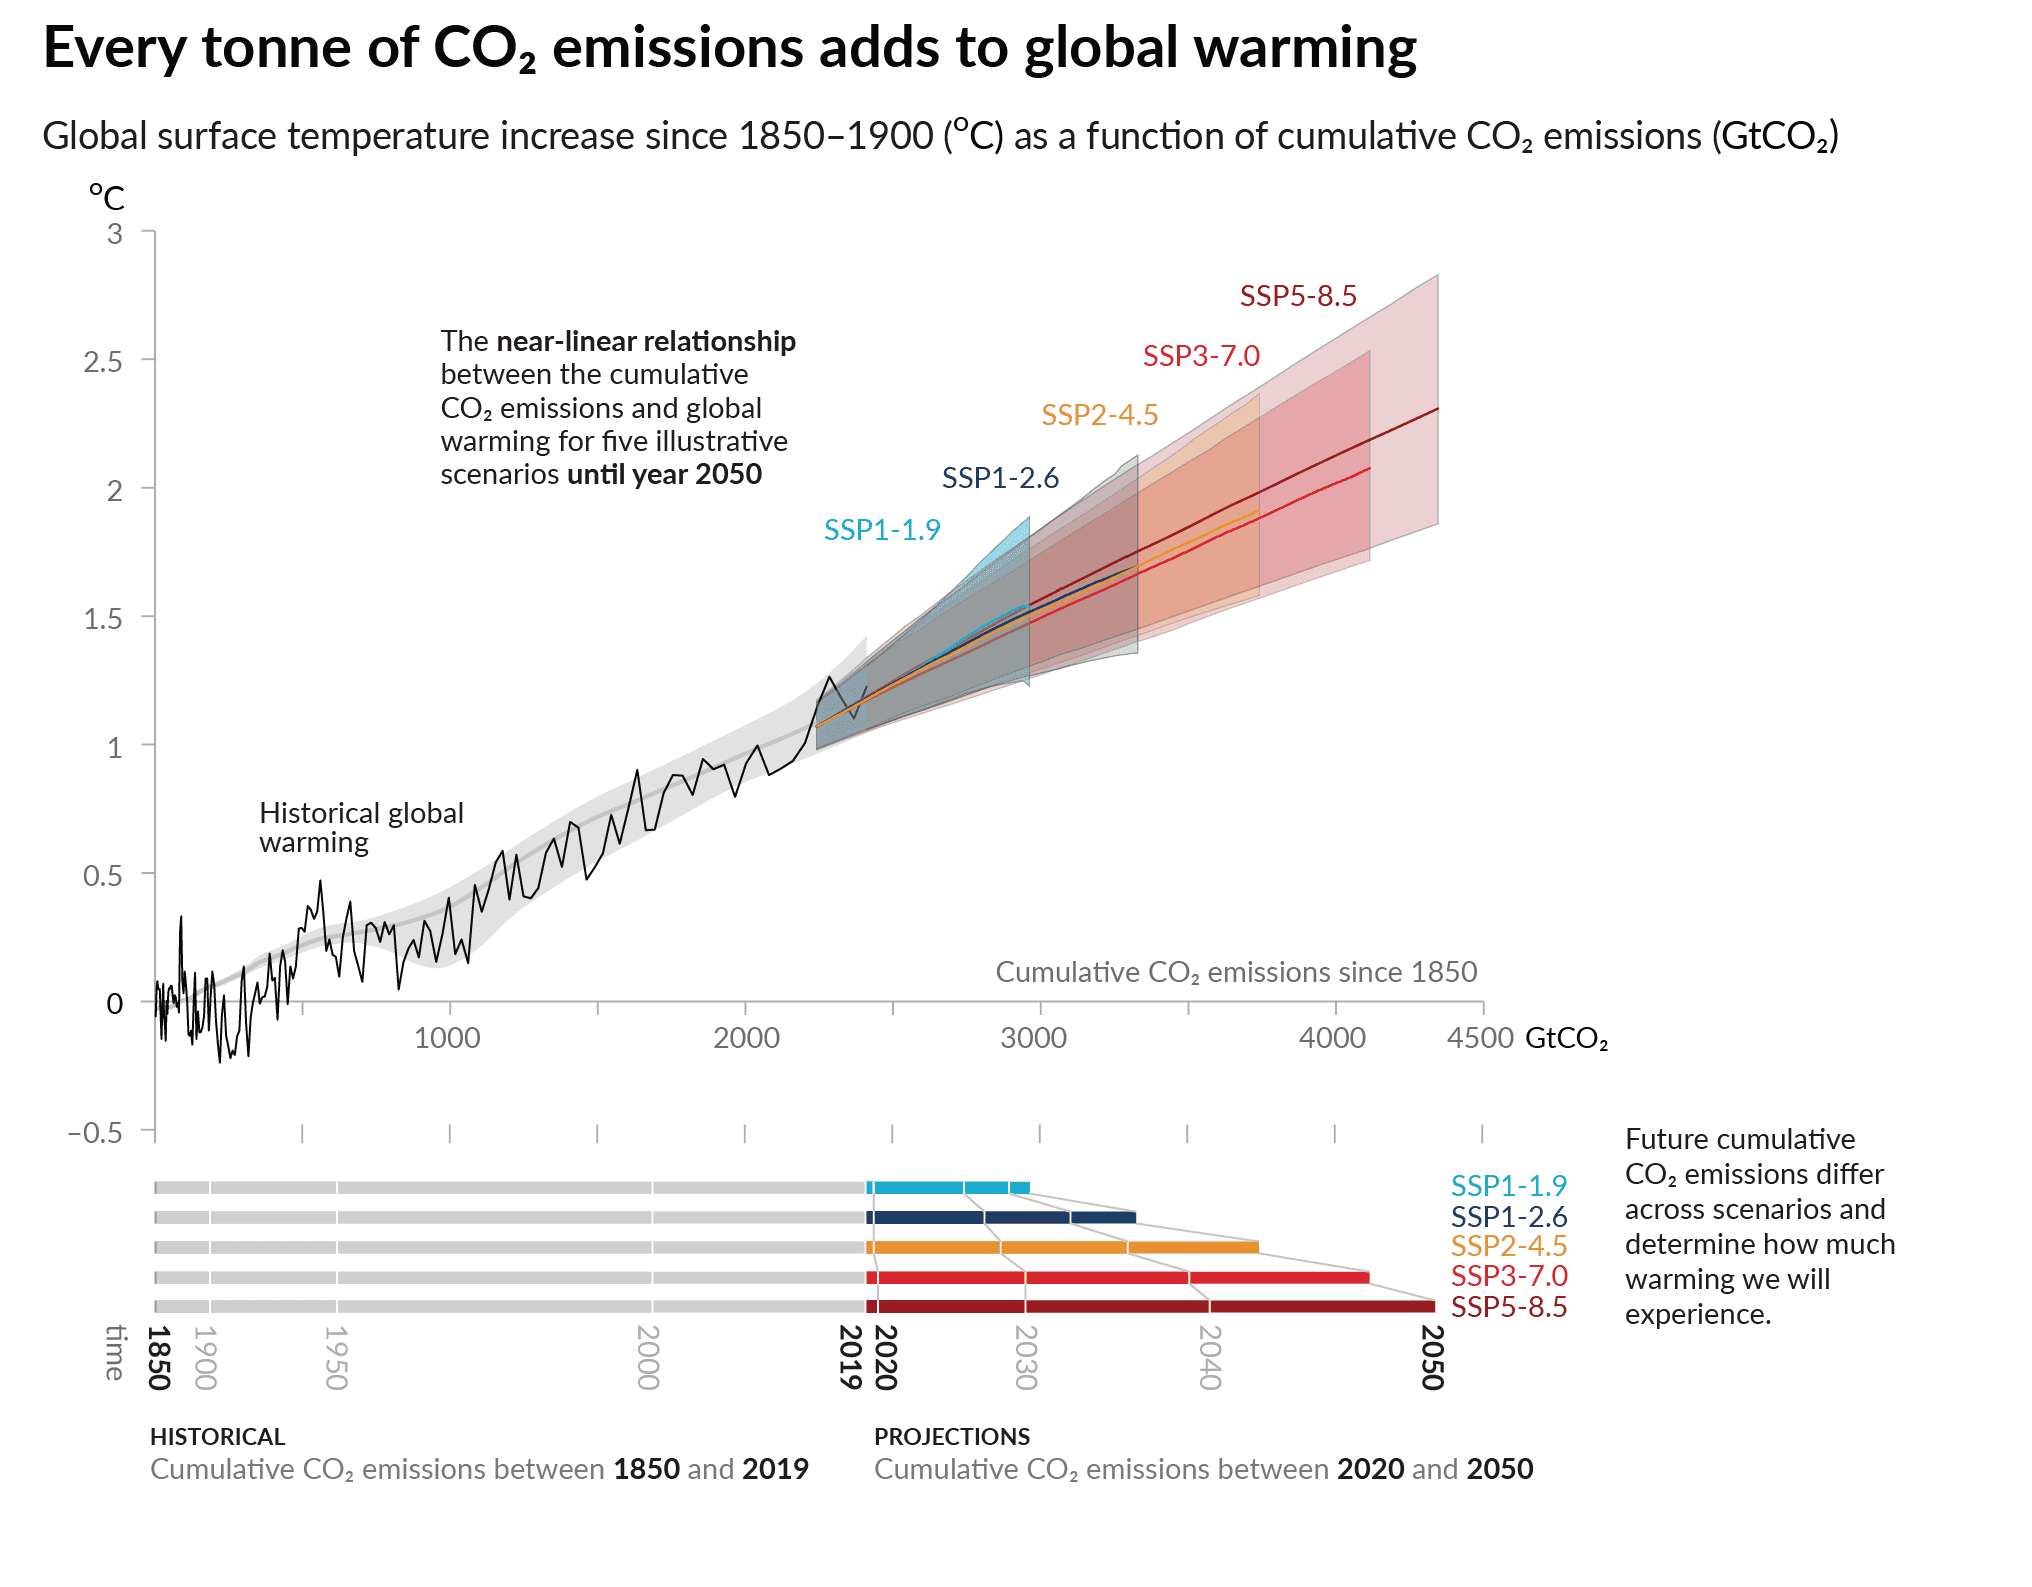
Global mean surface temperature has increased by approximately 1.09°C (with a range of 0.95°C to 1.20°C) from 1850 to 1900 through to 2011 to 2020. By the late 2010s, human-induced warming reached about 1°C above pre-industrial levels, with current rates around 0.2°C per decade. That leaves you with a very narrow budget: you're managing climate strategy in a world that's already more than halfway to the 1.5°C threshold, with the Paris Agreement's "well below 2°C" upper bound feeling increasingly tight.
For your internal communications and target-setting, the takeaway is simple: when you reference "pre-industrial," you mean the 1850 to 1900 average, and we've warmed roughly 1.1 to 1.2°C since then. That's the number to put in your board slides and transition plans.
Pre industrial levels of CO₂: from ~280 ppm to 420+ ppm today
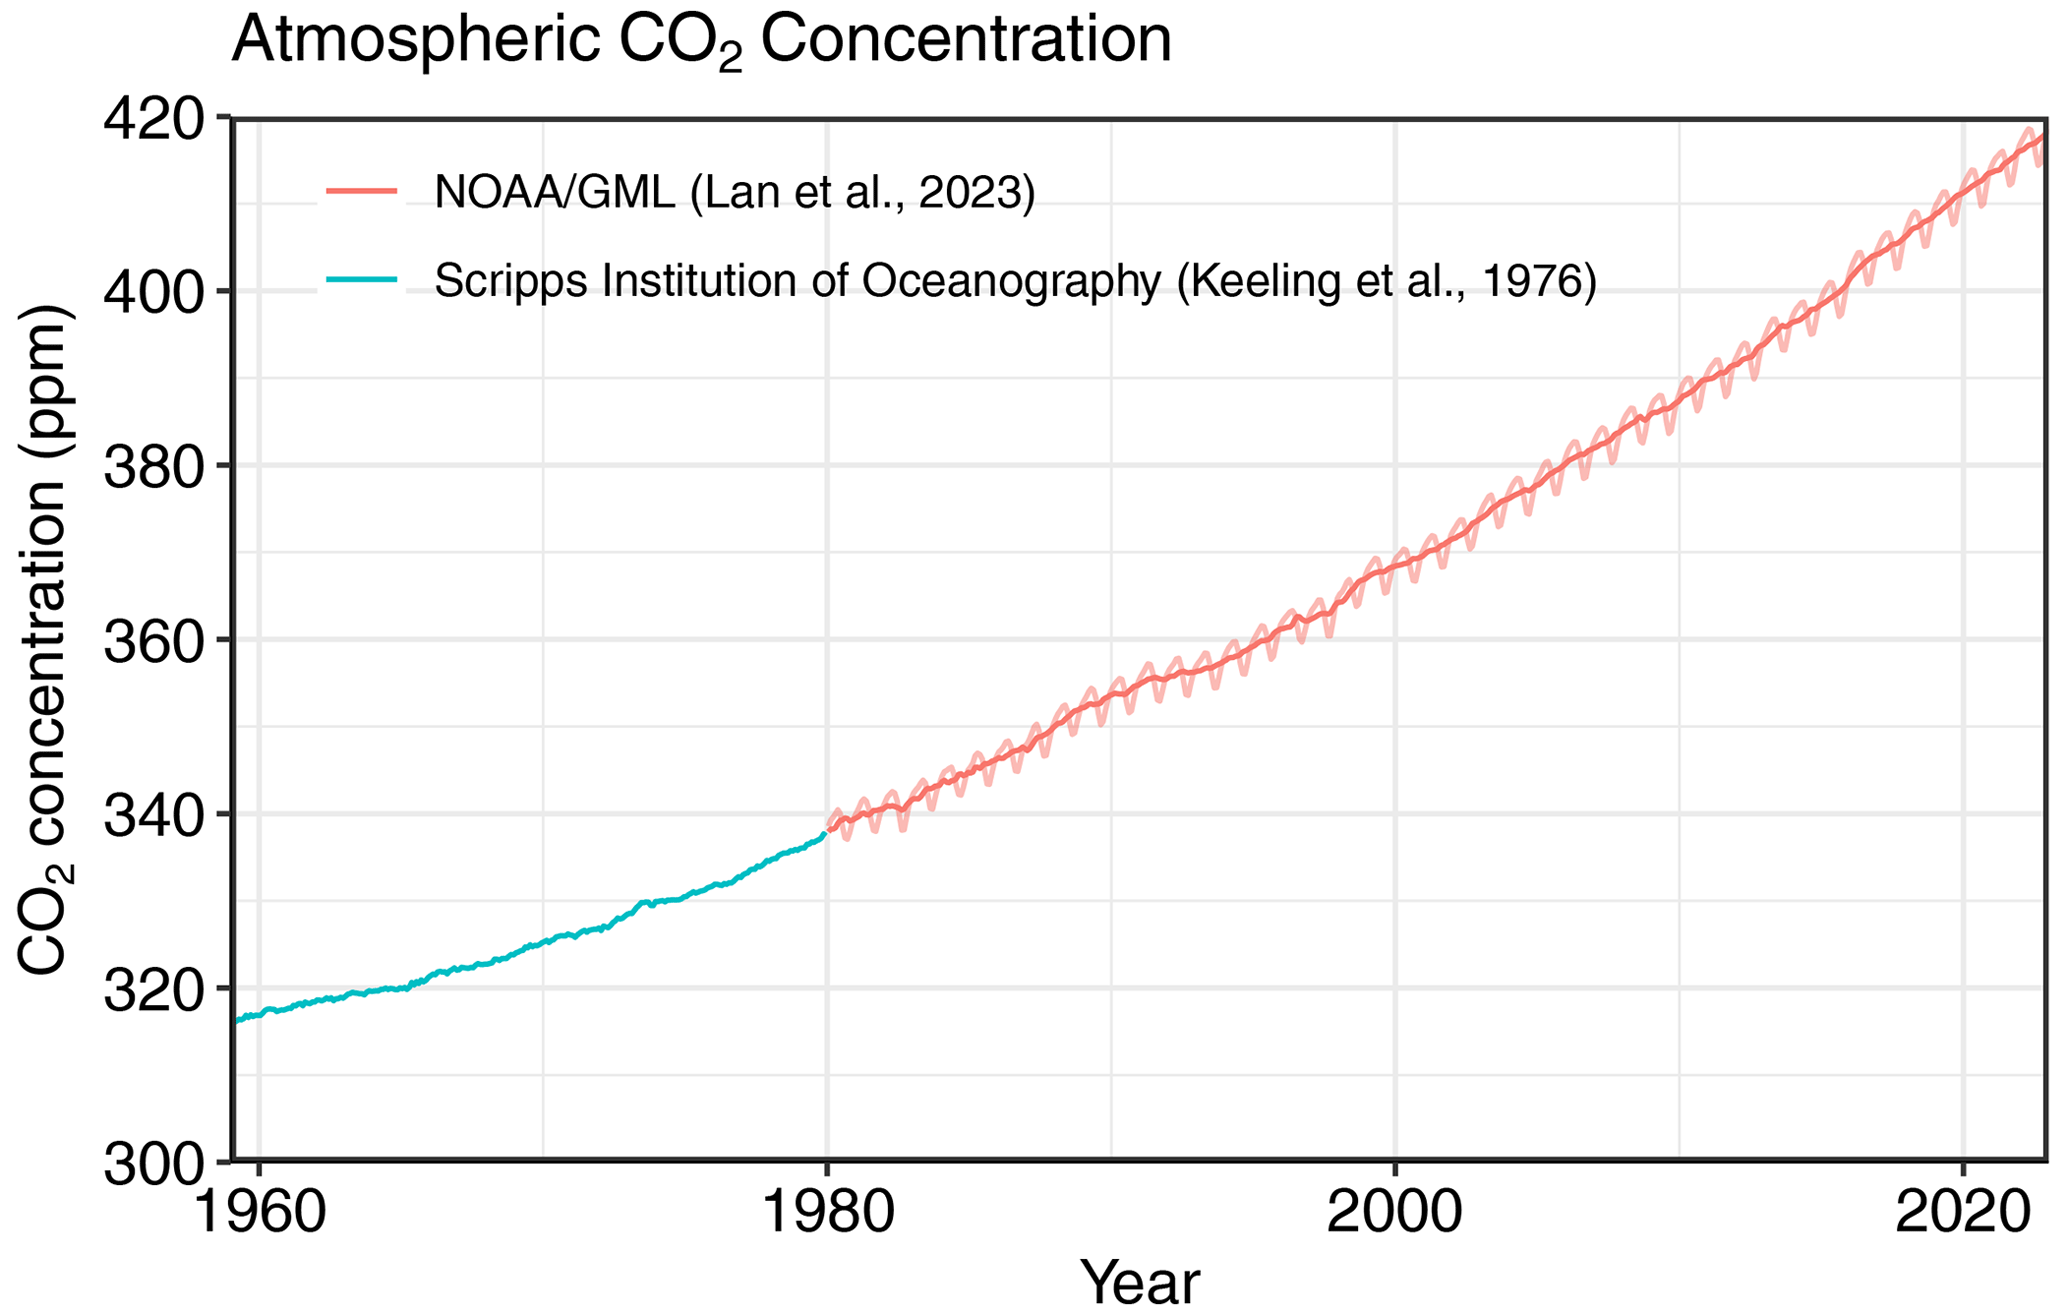
Atmospheric CO₂ concentration tells the same story of overshoot. Pre-industrial CO₂ levels, before 1750, sat at about 280 parts per million (ppm). In 2024, atmospheric CO₂ reached 423.9 ppm, a 52% increase above pre-industrial levels, with 2023 data showing 419 ppm and a 49% rise. That's not a marginal drift; it's a structural shift in the composition of the atmosphere, driven almost entirely by human activity.
Here's a quick reference table you can reuse internally:
This gap between pre-industrial CO₂ levels and today's concentrations is why deep decarbonisation matters more than ever, and why the role of carbon credits is strictly limited to residual emissions you genuinely cannot eliminate. The scale of the overshoot means there's no room for low-quality offsets or "business as usual plus credits" strategies.
From the global pre-industrial baseline to your 1.5°C-aligned targets
The Paris Agreement commits signatories to hold global temperature increase to well below 2°C and pursue efforts to limit it to 1.5°C above pre-industrial levels. Under the EU Climate Law and national frameworks like Germany's Klimaschutzgesetz, this commitment is enshrined in law, setting sectoral and annual GHG reduction targets with net neutrality goals (e.g., 2045 in Germany). But how does a global temperature limit translate into your company's 2030 near-term target and net-zero commitment?
It works like this: the IPCC and IEA develop scenarios that model pathways compatible with staying below 1.5°C or 2°C relative to the 1850 to 1900 baseline. These scenarios project how quickly global emissions must fall, sector by sector. The IEA's Net Zero Emissions by 2050 scenario, for example, translates the Paris 1.5°C goal into a global energy pathway that sees warming peak at around 1.65°C before returning below 1.5°C by 2100, reflecting inevitable overshoot and the need for CO₂ removal.
%2520(light).png)
The Science Based Targets initiative (SBTi) then takes these pathways and operationalises them for corporates. SBTi's updated criteria require that new targets be consistent with limiting warming to well below 2°C or 1.5°C above pre-industrial levels, and targets aligned only with 2°C are no longer approved. The Corporate Net-Zero Standard provides guidance and tools to set net-zero targets consistent with 1.5°C.
Here's your practical three-step routine to check whether your targets are genuinely 1.5°C-consistent:
- Select an IPCC or IEA 1.5°C scenario (e.g., SSP1-1.9, IEA NZE) and confirm it references the 1850 to 1900 baseline.
- Map that scenario to your sector using SBTi's sectoral decarbonisation approaches or similar methodologies to determine the required annual reduction rate.
- Define your base year, near-term target (typically 2030), and net-zero year (e.g., 2040 or 2050), ensuring that your trajectory stays within the carbon budget implied by the chosen pathway.
One common confusion: your company base year (e.g., 2019 or 2020 emissions) is not the same as the pre-industrial baseline. The pre-industrial baseline sets the global temperature limit; your base year is simply your starting point for measuring reductions. The link between them is the carbon budget: the cumulative emissions the world can still emit to stay within 1.5°C, and your fair or science-based share of that budget.
How pre industrial baselines show up in CSRD, ESRS E1 and DACH climate law
If you're reporting under the Corporate Sustainability Reporting Directive (CSRD) or preparing for it, you'll already know that climate disclosures have shifted from voluntary storytelling to mandatory, auditable evidence. ESRS E1 requires companies to disclose whether their GHG emission reduction targets are science-based and compatible with limiting global warming to 1.5°C above pre-industrial levels. You must specify the framework used (e.g., SBTi), the methodology, sectoral pathway, underlying climate and policy scenarios, and external assurance status. Disclosures must include your current base year and baseline value, target values for 2030 and (if available) 2050, and a statement on whether targets are science-based and 1.5°C-compatible.
-white.png)
In plain language, this means your sustainability report needs to show the chain of logic from "we commit to 1.5°C" all the way back to a recognised pre-industrial baseline. Auditors and supervisors will look for explicit references to IPCC scenarios, SBTi validation, or equivalent evidence that your targets are not just aspirational but mathematically grounded in a 1.5°C carbon budget.
Here's a short CSRD-ready checklist for your climate target documentation:
- Reference baseline and period: State that your targets are aligned with limiting warming to 1.5°C above pre-industrial levels, using the IPCC 1850 to 1900 reference.
- Framework and methodology: Cite SBTi, an IPCC SSP scenario, or IEA pathway, and document which sectoral decarbonisation approach you've applied.
- Base year and target years: Clearly disclose your emissions base year (e.g., 2020), your 2030 near-term target, and your net-zero year (2040, 2045, or 2050).
- Scenarios used: Name the climate and policy scenarios that underpin your transition plan (e.g., IEA NZE, IPCC SSP1-1.9).
- Assurance status: Indicate whether targets are externally validated (e.g., SBTi-approved) and whether your emissions inventory is third-party assured.
By making this documentation explicit, you not only meet ESRS E1 requirements but also create an internal governance artefact that finance, legal, and the board can rely on when approving capital allocation or green financing.
What today's gap to pre industrial means for carbon credits and removals
We're now about 50% above pre-industrial CO₂ concentrations and roughly 1.1 to 1.2°C warmer. That means the remaining carbon budget to stay within 1.5°C is very small. Many IPCC and IEA 1.5°C pathways allow a temporary temperature overshoot before returning below 1.5°C by 2100, which implies large-scale CO₂ removal later in the century. For your company, the implication is clear: deep value-chain decarbonisation must come first, and carbon credits should only address a small, genuinely residual footprint.
This is where the quality of your carbon credit portfolio becomes critical. Because we're so far above pre-industrial levels, marginal or low-integrity projects simply don't cut it in a 1.5°C-aligned strategy. You need credits that deliver real, additional, and durable climate impact, and you need evidence packs that can stand up to CSRD audits and stakeholder scrutiny.
Senken's Sustainability Integrity Index evaluates projects across more than 600 data points, covering carbon impact, additionality, permanence, co-benefits, and compliance with frameworks like the ICVCM Core Carbon Principles and CSRD. Only the top 5% of projects pass this assessment. For large DACH companies, this rigour translates into portfolios that are defensible under audit and compatible with your 1.5°C narrative.
A simple decision frame for using carbon credits in a 1.5°C-consistent way:
- Quantify your residual emissions: After applying all feasible abatement in your value chain, estimate what remains (typically hard-to-abate Scope 1 and Scope 3 emissions).
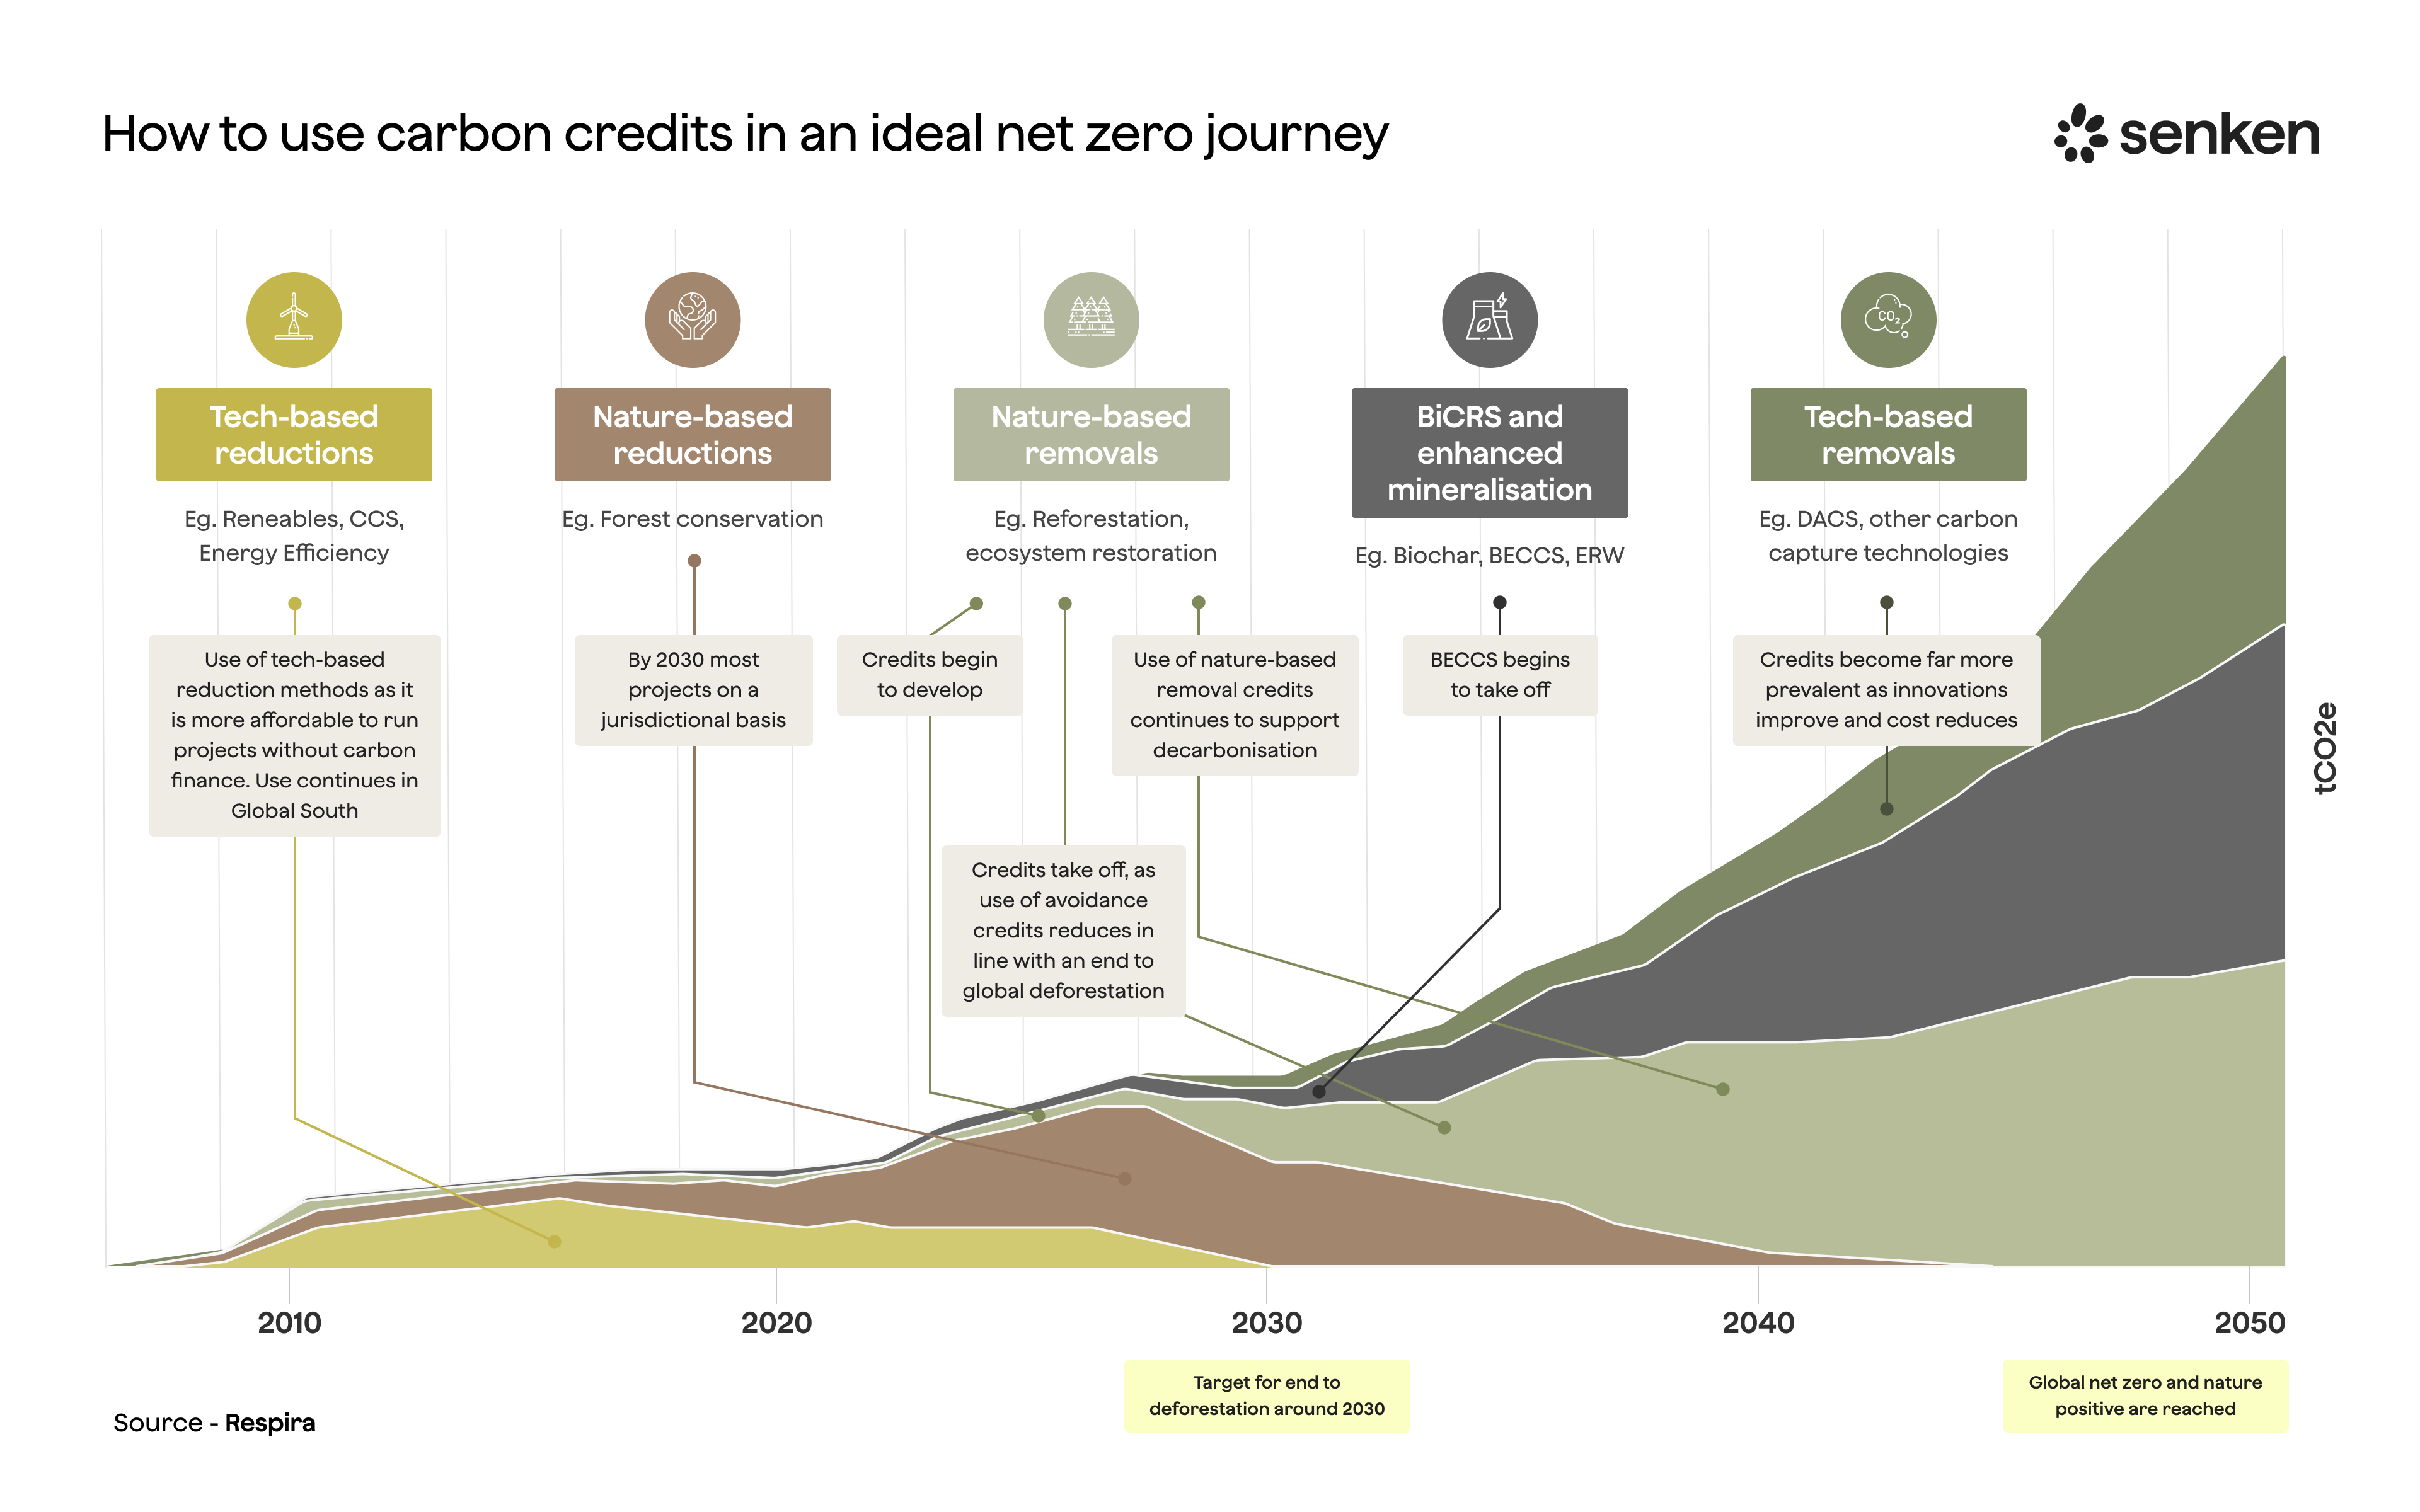
- Choose removal types suited to permanence needs: For long-term neutralisation, prioritise durable removals like biochar, enhanced weathering, or direct air capture. For near-term neutralisation, high-quality nature-based solutions with robust monitoring can play a role.
- Build audit-ready documentation: For every credit retired, maintain evidence of additionality, MRV (measurement, reporting, and verification) data, and alignment with ICVCM or SBTi guidance. Senken's platform and reporting tools make this straightforward, so your sustainability and finance teams aren't scrambling during CSRD assurance season.
Case in point: Vodafone Germany used Senken's SII framework to build an Oxford-aligned removals portfolio for neutralising residual Scope 1 and 2 emissions. The outcome was not just carbon neutrality but also simplified audits through ready-to-use evidence packs and long-term price and supply confidence. Similarly, Deutsche Telekom worked with Senken to create a diversified, high-integrity portfolio across key regions, enabling data-driven storytelling that strengthens stakeholder trust.
The bottom line: in a world that's already more than 1°C above pre-industrial levels, any use of carbon credits must be tightly coupled to genuine reductions and supported by transparent, science-based due diligence. That's the only way to maintain credibility when you claim alignment with 1.5°C pathways.