.svg)

The EU Emissions Trading System (EU ETS) is the world's first and largest carbon market, launched in 2005 to cut greenhouse gas emissions cost-effectively. It works on a simple principle: a declining cap limits total emissions from covered sectors—power, industry, aviation, and now maritime—while companies trade allowances, each worth one tonne of CO₂. The cap is tightening fast: a 62% reduction by 2030 versus 2005 for ETS sectors, driven by a linear reduction factor that has jumped to 4.3–4.4% per year.
For heads of sustainability in large companies, EU ETS is no longer a side compliance issue—it's a hard constraint on emissions, operating costs, and capital allocation. With EUA prices hovering around €60–80 per tonne and a new parallel system (ETS2) covering buildings and road transport from 2027, the financial and strategic stakes are rising. This guide won't rehash every regulation. Instead, it will help you quickly assess your exposure, integrate EU ETS into internal carbon pricing and roadmaps, align with CSRD and science-based targets, and use high-quality voluntary credits alongside—not instead of—your compliance obligations, all while avoiding greenwashing.

EU ETS in a nutshell: what it is and why it matters for DACH corporates
The EU Emissions Trading System (EU ETS) is the world's first and largest carbon market, launched in 2005 as the cornerstone of Europe's climate policy. At its core, it operates on a simple cap-and-trade principle: a cap limits total greenhouse gas emissions from covered installations, and that cap declines each year in line with climate targets. One EU Allowance (EUA) gives the holder the right to emit one tonne of CO₂ equivalent . Companies must surrender enough allowances to match their annual verified emissions or face penalties.
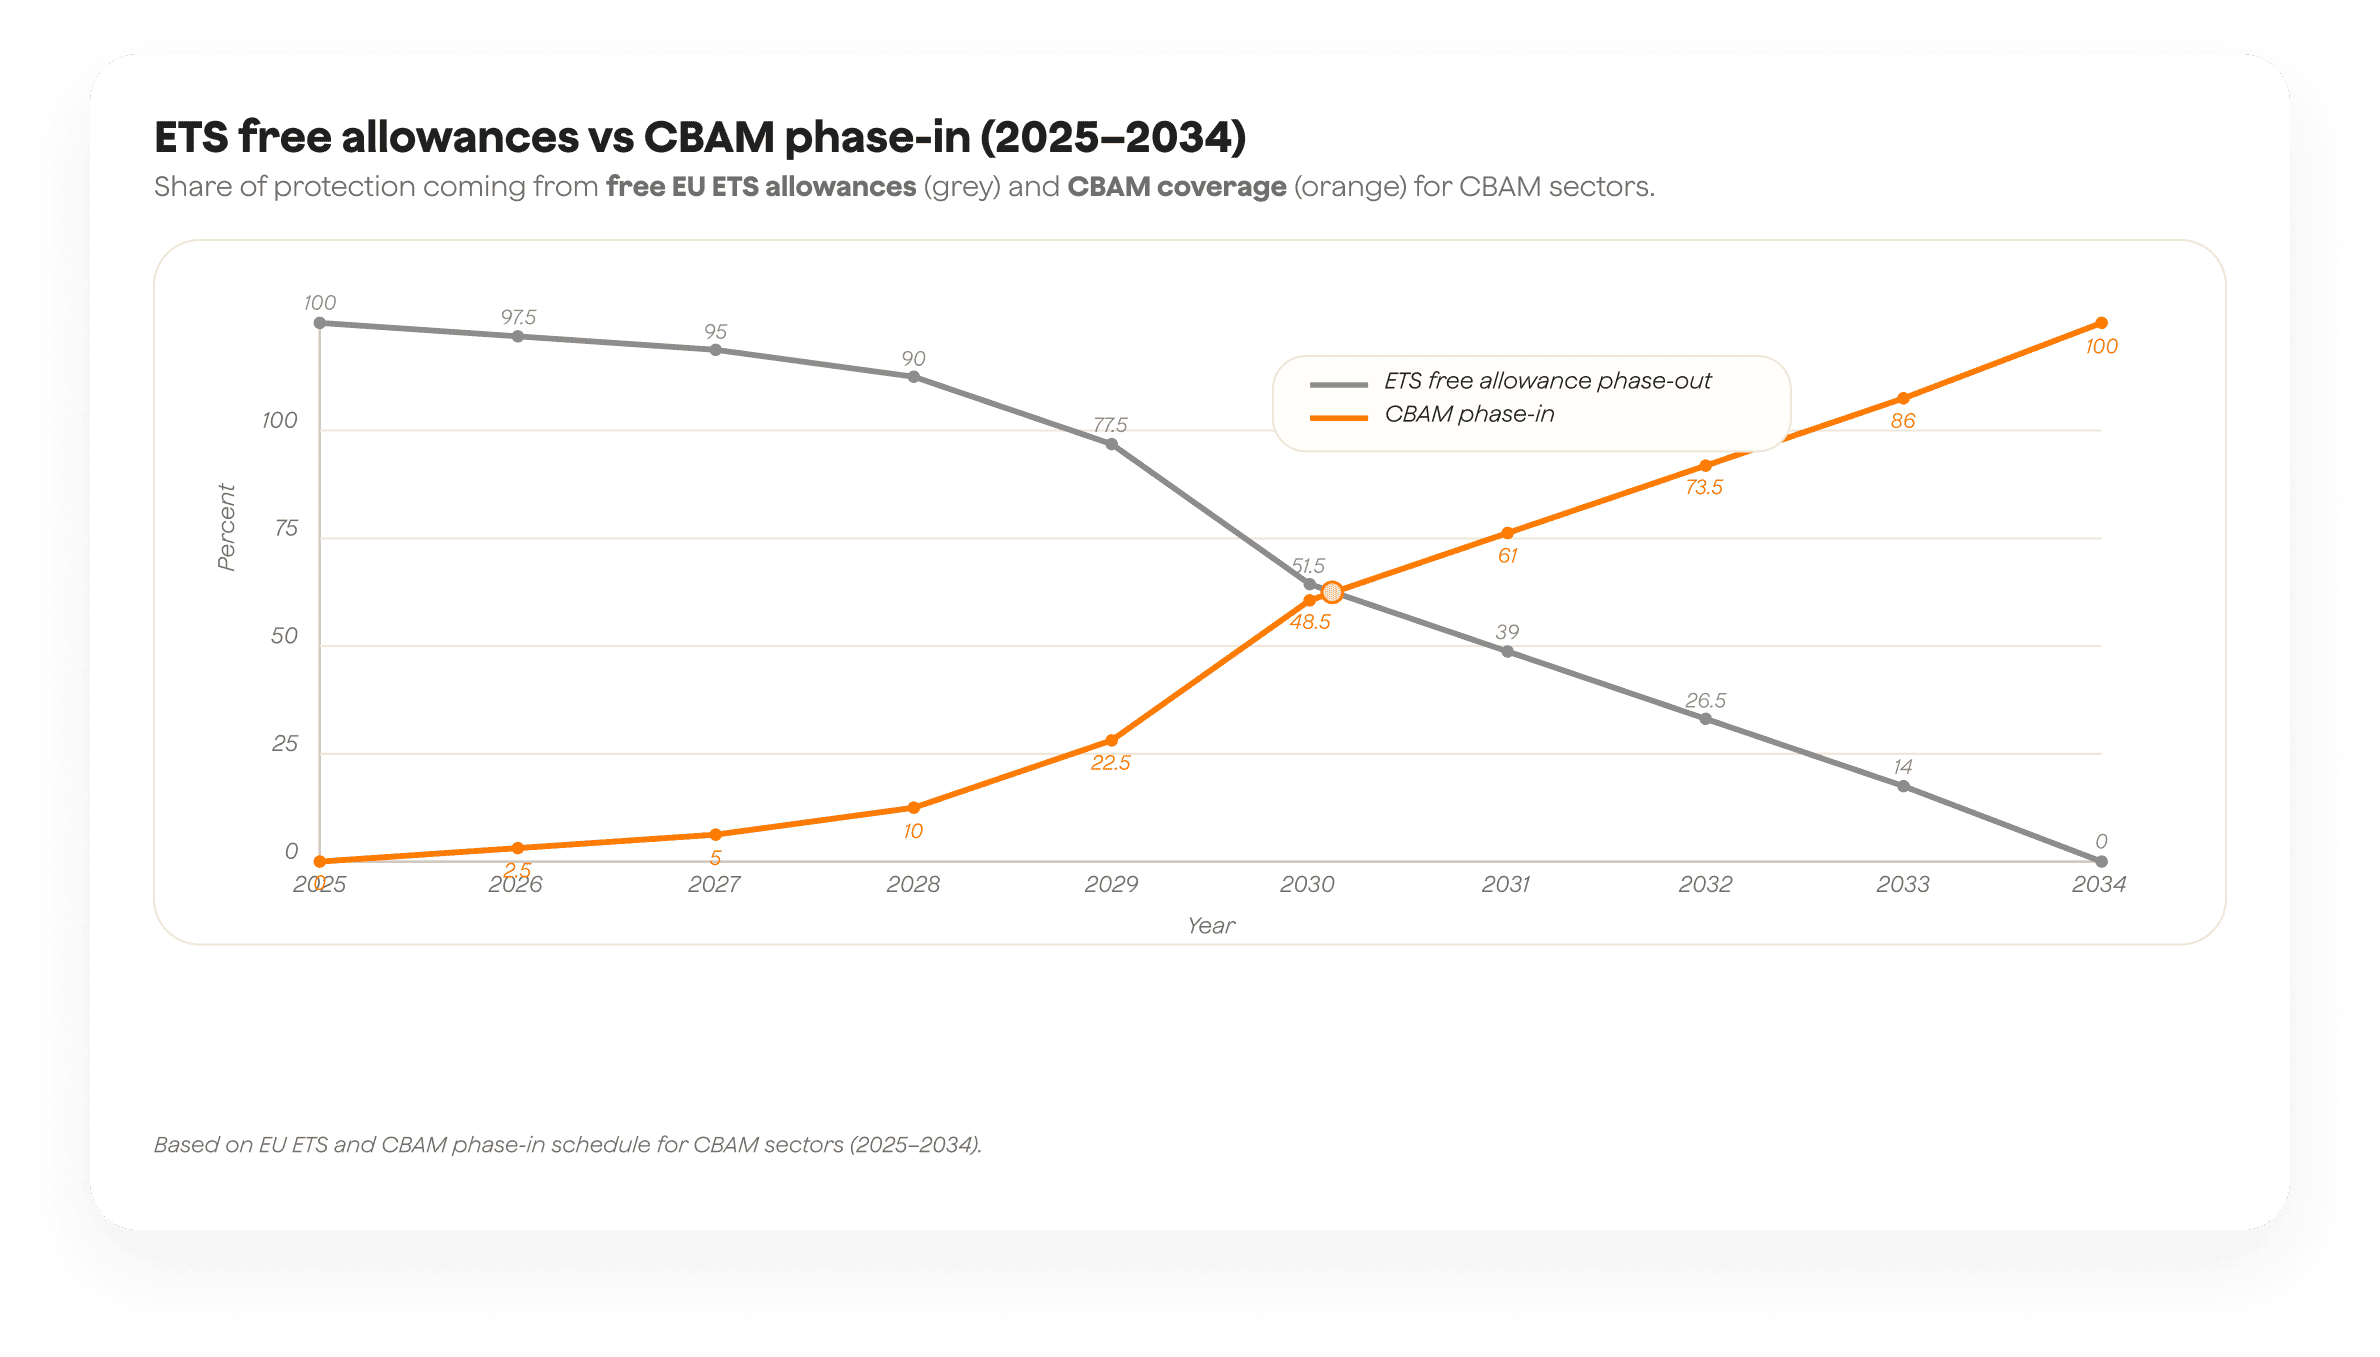
The EU ETS is now in its fourth trading phase (2021–2030) and targets a 62% reduction in ETS sector emissions by 2030 versus 2005 levels . To deliver this, the linear reduction factor increased from 2.2% per year (2021–2023) to 4.3% for 2024–2027, and 4.4% for 2028–2030 . Allowances are primarily auctioned, though some free allocation remains for sectors at risk of carbon leakage, a share that is gradually phasing out as the Carbon Border Adjustment Mechanism (CBAM) takes over.
This is no longer a side compliance task. With EUA prices trading in the €60–€80/t range in recent years, with peaks above €100/t, carbon is now a material line item. A typical large industrial installation emitting 100,000 tonnes annually faces €6–8 million in annual compliance costs at current prices. That figure sits on your CFO's budget and should directly inform your capital allocation, internal carbon pricing, and decarbonisation roadmap. The tightening cap and Market Stability Reserve ensure that cost pressure will only increase through 2030 and beyond.
Are you exposed? Mapping EU ETS and ETS2 across your group
Direct vs indirect EU ETS exposure in typical DACH corporate structures
The EU ETS covers power and heat generation, energy-intensive industries (refineries, steel, cement, chemicals), intra-EEA aviation, and from 2024 maritime transport (100% of emissions for intra-EU voyages, 50% for voyages to/from non-EU ports) . Gases covered include CO₂, N₂O from nitric and adipic acid production, and PFCs from aluminium.
For a diversified DACH corporate, exposure typically falls into three buckets:
Direct exposure: Your legal entity operates an installation covered by the EU ETS. This is common for manufacturers with combustion plants, industrial boilers, or on-site generation, and for any shipping or aviation operations within Ethe EA scope.
Indirect exposure via electricity: Your operations consume grid power. While you don't surrender allowances, power generators pass through their carbon costs in electricity prices. For data-centre-heavy businesses like telecoms or cloud providers, this is your primary ETS cost driver.
Value-chain exposure: Suppliers or customers face ETS costs that flow into procurement prices (e.g. steel, aluminium, cement) or create transition risks in your Scope 3 footprint.
Run a simple internal mapping exercise: list all EU-based facilities, check registry coverage for each site, quantify direct emissions subject to ETS, and estimate indirect exposure through electricity and key materials procurement. Finance and procurement should be at the table for this, not just sustainability.
What ETS2 for buildings and road transport means for you
ETS2 applies upstream to fuel suppliers for buildings and road transport, with monitoring, reporting and verification starting in 2025 and full operation in 2027, targeting a 42% reduction by 2030 versus 2005 . For corporates, this means:
- Fleet and logistics: If you operate company vehicles or logistics fleets running on diesel or petrol in the EU, you'll see rising fuel costs as suppliers pass through their ETS2 obligations.
- Buildings and real estate: Heating fuels for offices, warehouses, and retail sites will carry an embedded carbon price. Lease contracts and energy procurement agreements should anticipate this.
- Supply chain impacts: Suppliers facing ETS2 costs in their transport or heating will adjust prices, especially in logistics, distribution, and manufacturing.
Map these exposures now. By 2027, ETS2 will be a second carbon cost layer across your operations, and CSRD reporting will expect you to quantify the financial impact.
From compliance line item to strategic lever: using EU ETS in your decarbonisation roadmap
Using EUA prices to set or update your internal carbon price
Many DACH companies still treat EU ETS as a finance or legal task. That's a missed opportunity. The tightening cap and rising EUA prices send a clear signal: carbon-intensive assets and processes are becoming structurally more expensive to operate. Your internal carbon price should reflect that reality and guide capital allocation, project appraisal, and technology choices.
Start with a pragmatic band linked to EUA market dynamics. For example:
- Low scenario: €60/t (floor based on recent auction clearing prices)
- Central scenario: €80/t (mid-range of recent trading)
- High scenario: €100/t+ (stress-test for volatility or policy tightening)
Update this annually or when major policy changes occur (e.g. cap rebasing, MSR adjustments, or new sectoral coverage). Assign ownership to a cross-functional team, sustainability, finance, risk, and feed it into your investment appraisal process. If a heat electrification project saves 10,000 tonnes of CO₂ per year, that's €800,000 annually at the central scenario. Make that visible in the business case.
Deciding when to abate vs buy allowances
A common question: should we invest in abatement or simply purchase EUAs to cover emissions? The answer depends on your marginal abatement cost curve versus expected EUA prices.
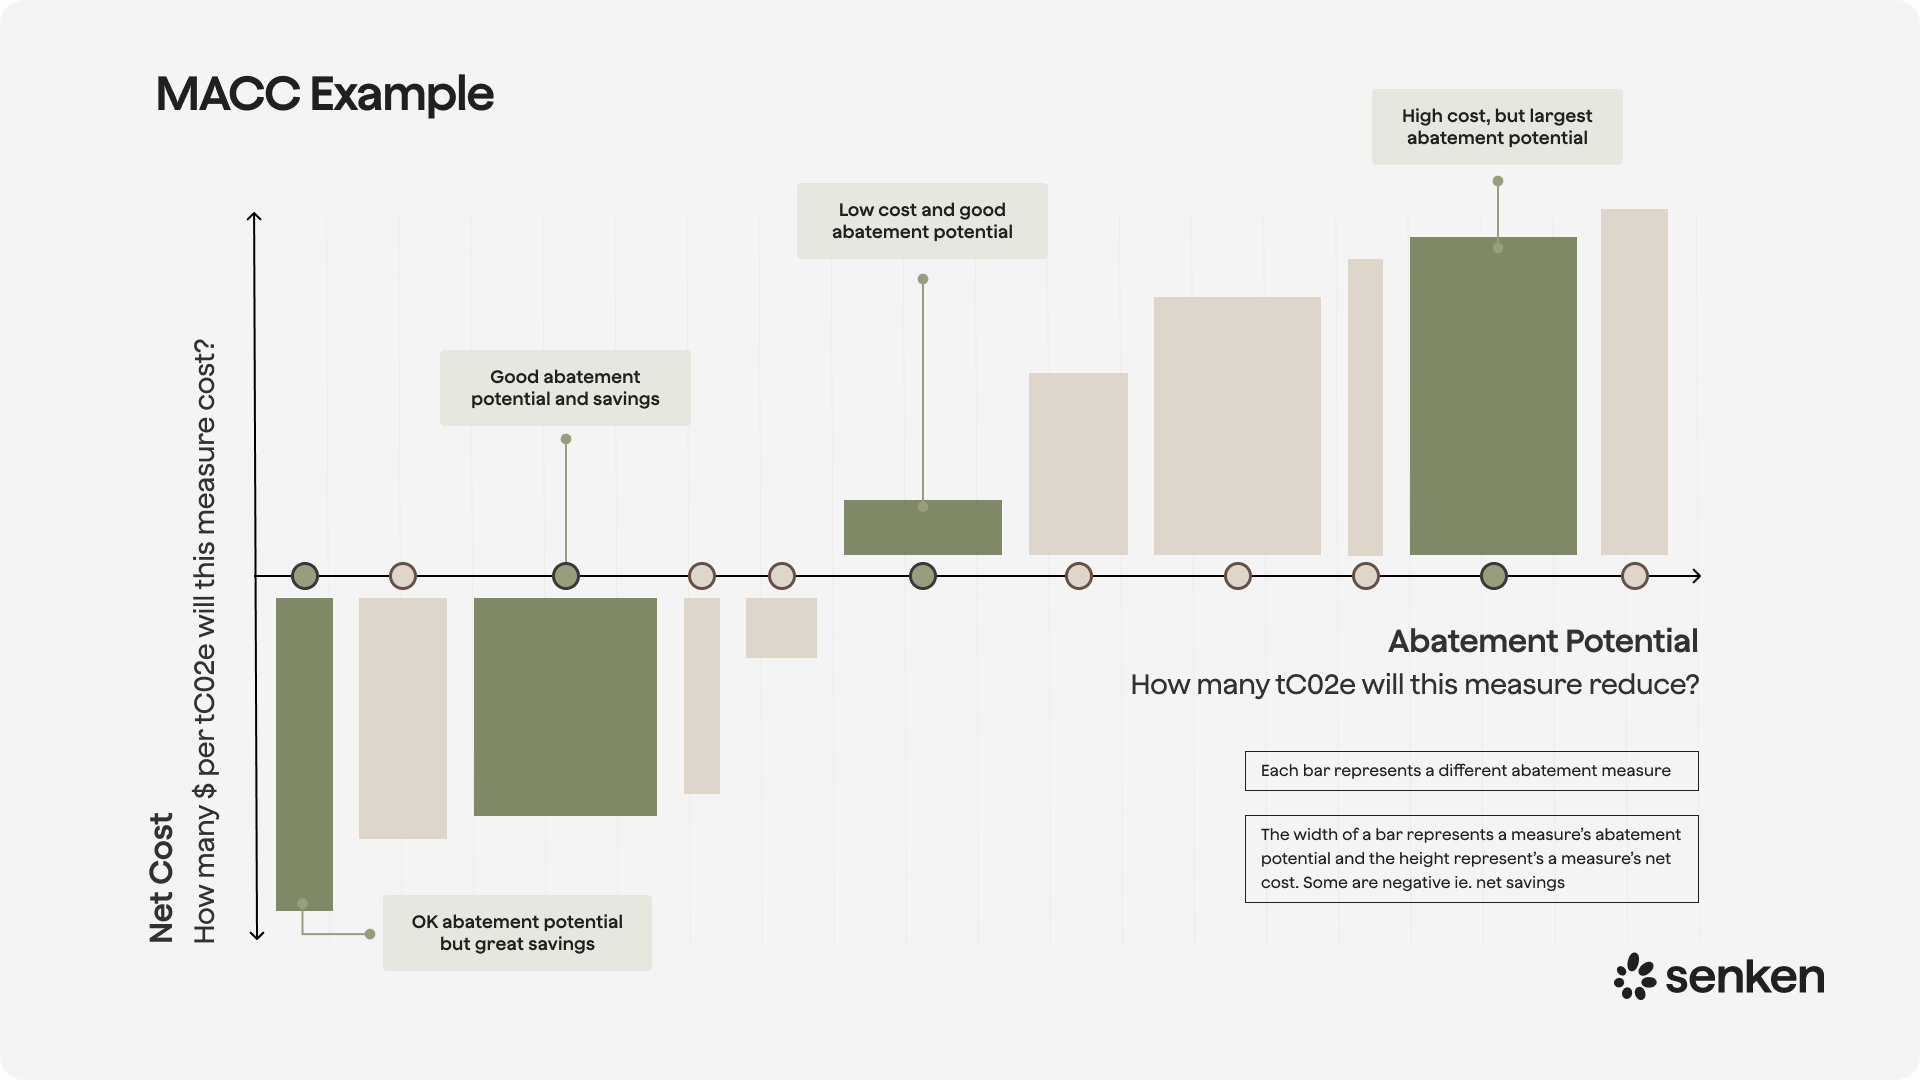
Build a simple 2x2 framework:
- Abatement cost < EUA price: Invest in reduction (e.g. fuel switching, energy efficiency, electrification). This creates long-term value and reduces exposure to price volatility.
- Abatement cost > EUA price but strategically important: Consider phased investment or hybrid approaches (partial abatement + allowance purchase) to derisk future price rises and align with SBTi or net-zero targets.
- Abatement cost >> EUA price and non-strategic: Purchase allowances short-term, but monitor the gap. As the cap tightens and free allocation phases out, this calculus will shift.
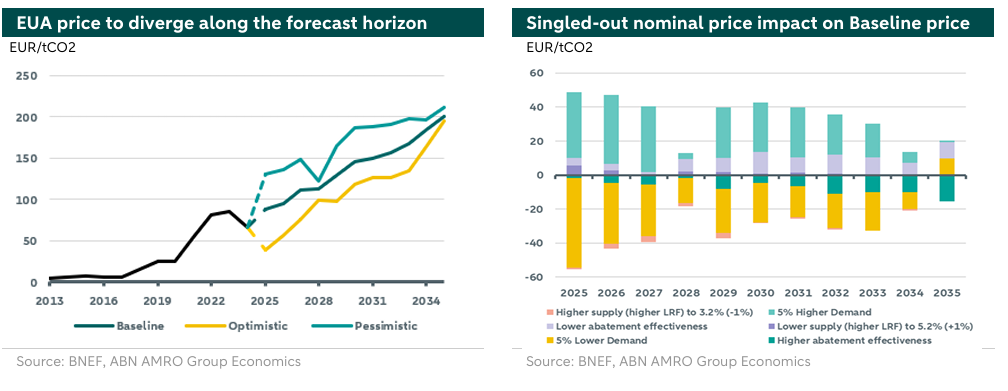
For example, a cement plant evaluating carbon capture might face €120/t abatement costs. At today's €70/t EUA price, purchasing is cheaper. But if EUA prices rise to €100/t by 2028, as recent forward curves suggest , and CBAM removes free allocation, early investment locks in certainty and avoids last-minute scrambling. Use scenario planning and multi-year abatement vs purchase modelling to inform your roadmap, and revisit it annually as market and policy conditions evolve.
Reporting and governance: EU ETS under CSRD, ESRS E1 and GHG Protocol
What ESRS E1 expects you to disclose about EU ETS
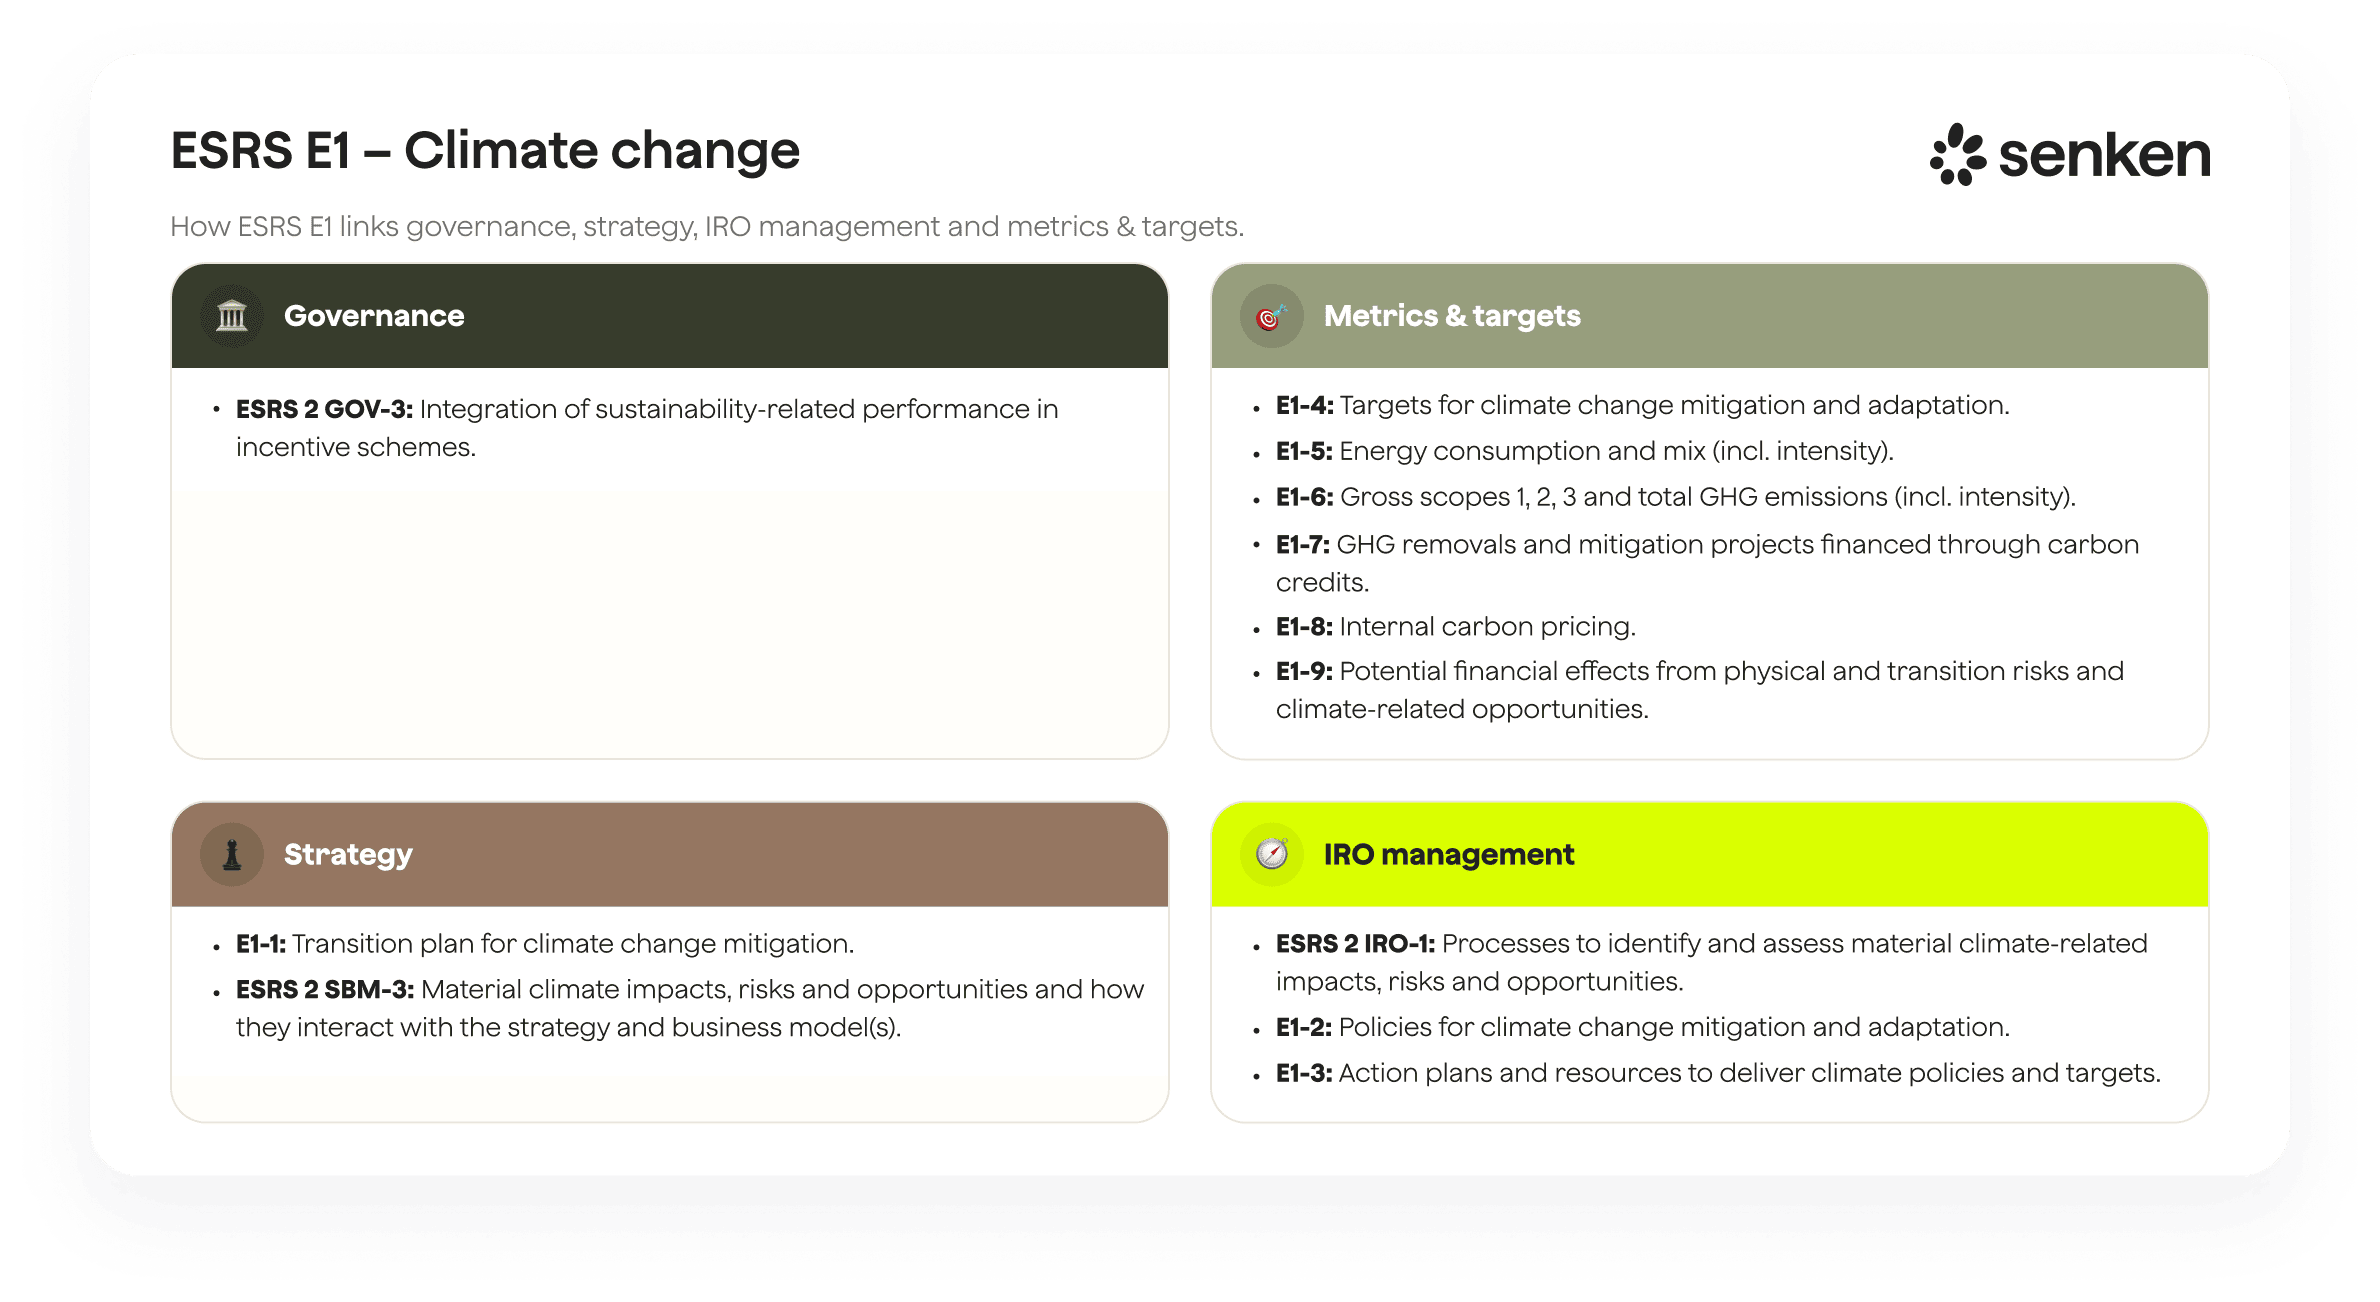
Under the Corporate Sustainability Reporting Directive (CSRD), ESRS E1 requires disclosure of gross Scopes 1–3 emissions, transition plans, internal carbon pricing, emissions allowances held and projected to 2030, and potential financial effects from ETS liabilities . For sustainability leaders, this translates into a clear reporting checklist:
- Gross Scope 1 emissions broken down by entity and geography, with a subset identified as EU ETS-covered.
- Emissions allowances held at year-end and allowances surrendered during the reporting period.
- Projected allowance needs to 2030, based on your decarbonisation roadmap and expected emissions trajectory.
- Internal carbon price methodology and how it links to EUA market dynamics.
- Financial impacts: quantified exposure from EU ETS obligations, both current liabilities and potential future costs under tightening cap scenarios.
EU ETS emissions are a subset of GHG Protocol Scope 1 (direct emissions from owned/controlled sources). Your electricity-related exposure sits in Scope 2 (indirect emissions from purchased energy), and value-chain impacts (e.g. from suppliers subject to ETS or CBAM) appear in Scope 3. Align your data collection and reporting structure accordingly, and ensure consistency across ESRS, GHG Protocol, and TCFD-aligned risk disclosures.
Aligning EU ETS data with Scope 1–3 reporting and assurance
The shift to mandatory assurance under CSRD means your EU ETS data must be audit-ready. Set up a clear governance flow:
- Sustainability owns the narrative, targets, and transition plan logic.
- Finance/controlling manages allowance procurement, registry transactions, and cost accounting.
- Operations provides verified emissions data from installations.
- Risk assesses carbon price volatility, regulatory changes, and supply-chain exposure.
Build a shared data model that feeds CSRD/ESRS E1, your management accounts, and TCFD-style climate risk reporting. Document assumptions behind projected allowance needs, internal carbon price scenarios, and abatement roadmaps. External auditors will scrutinize these, especially as board-level accountability increases. Treat EU ETS data with the same rigor as financial KPIs, because under CSRD, it effectively is.
Combining the EU ETS with high-integrity voluntary carbon markets
Clear boundaries: EUAs vs voluntary carbon credits
One of the most common points of confusion: EU Allowances (EUAs) are compliance units for EU ETS-covered emissions. Voluntary carbon credits cannot be used to meet EU ETS obligations. This is a hard regulatory boundary. If your installation emits 50,000 tonnes covered by ETS, you must surrender 50,000 EUAs. Voluntary credits have no compliance value in that context.
Where voluntary credits do play a role:
- Non-ETS emissions: Scope 1 emissions not covered by EU ETS (e.g. refrigerants, non-energy industrial processes, or emissions from non-EU operations).
- Scope 2 and 3: Indirect emissions from electricity, heat, and your value chain, where you want to go beyond contractual or market-based instruments.
- Beyond-compliance ambition: Supporting high-quality carbon removal or avoidance projects to contribute to global net-zero goals and signal leadership, separate from regulatory compliance.

Keep the narrative clear: EU ETS drives compliance-led abatement in covered sectors; voluntary credits address emissions outside that perimeter or fund removals beyond what regulation requires. Avoid language like "offsetting our ETS emissions with credits", which invites greenwashing accusations and regulatory pushback.
Designing a voluntary credit strategy that is greenwashing-safe
Given that 68% of DAX40 companies that purchased carbon credits ended up supporting projects with no real climate impact , and 84% of carbon credits are considered high-risk according to the Max Planck Institute , integrity is non-negotiable. To build a robust voluntary credit policy alongside EU ETS:
- Prioritize reductions first: Voluntary credits should complement, not replace, your abatement roadmap. Follow the mitigation hierarchy: avoid, reduce, then use high-quality credits for residual emissions.
- Avoid high-risk methodologies: Renewable energy credits and cookstove projects have been rejected or heavily discounted by the Integrity Council for the Voluntary Carbon Market (ICVCM) and recent studies . Stick to methodologies with strong additionality, permanence, and third-party validation.
- Prevent double counting: Ensure credits correspond to emissions reductions or removals not already claimed under national inventories, ETS compliance, or other regulatory schemes. Document the carbon accounting boundary clearly.
- Use multi-layer due diligence: Don't rely solely on registry labels. Senken's Sustainability Integrity Index applies 600+ data points across five stages (project basics, carbon impact, beyond-carbon co-benefits, MRV, and compliance/reputation) to identify the top 5% of projects. This level of scrutiny is what CSRD assurance and Green Claims enforcement will expect.
Under Germany's forthcoming Green Claims Directive implementation and CSRD, vague "climate neutral" labels without detailed substantiation will be prohibited. Any voluntary credit claim must be backed by transparent, project-level evidence and align with your disclosed net-zero pathway. Using high-integrity credits from platforms that provide full traceability (vintage, project ID, retirement proof) and scientifically robust assessments is your best defense against reputational and regulatory risk.