
€71/t today, €169/t in 2045: The CFO case for offtakes

Author
Adrian WonsThis one is a bit different from our usual newsletters, because it goes a little deeper into the financial business planning behind carbon credits.
We’re in calls every week where the sustainability lead brings the CFO or board into the conversation. And the question is almost always the same: what is the actual business case for signing a removal offtake now, instead of waiting and buying spot later?
So we built the model.
We took the BloombergNEF removal price curve out to 2045, modelled an illustrative buyer that needs 50,000 tons of removals per year, tested the numbers across realistic WACC (weighted average cost of capital) bands, and compared the NPV (net present value) difference between locking in supply today and waiting.
The result was bigger than we expected.
And it holds up at every WACC we tested.
The setup
We modelled a buyer with a residual need of 50,000 tons of audit-grade removals per year (mix of nature and tech removal).
The forward price curve is the BloombergNEF Removal scenario, based on least-cost decarbonisation. It starts at about €71/t today, peaks near €133/t in 2030, dips to €90/t in 2032, climbs again to about €181/t by 2040, and settles around €169/t by 2045.
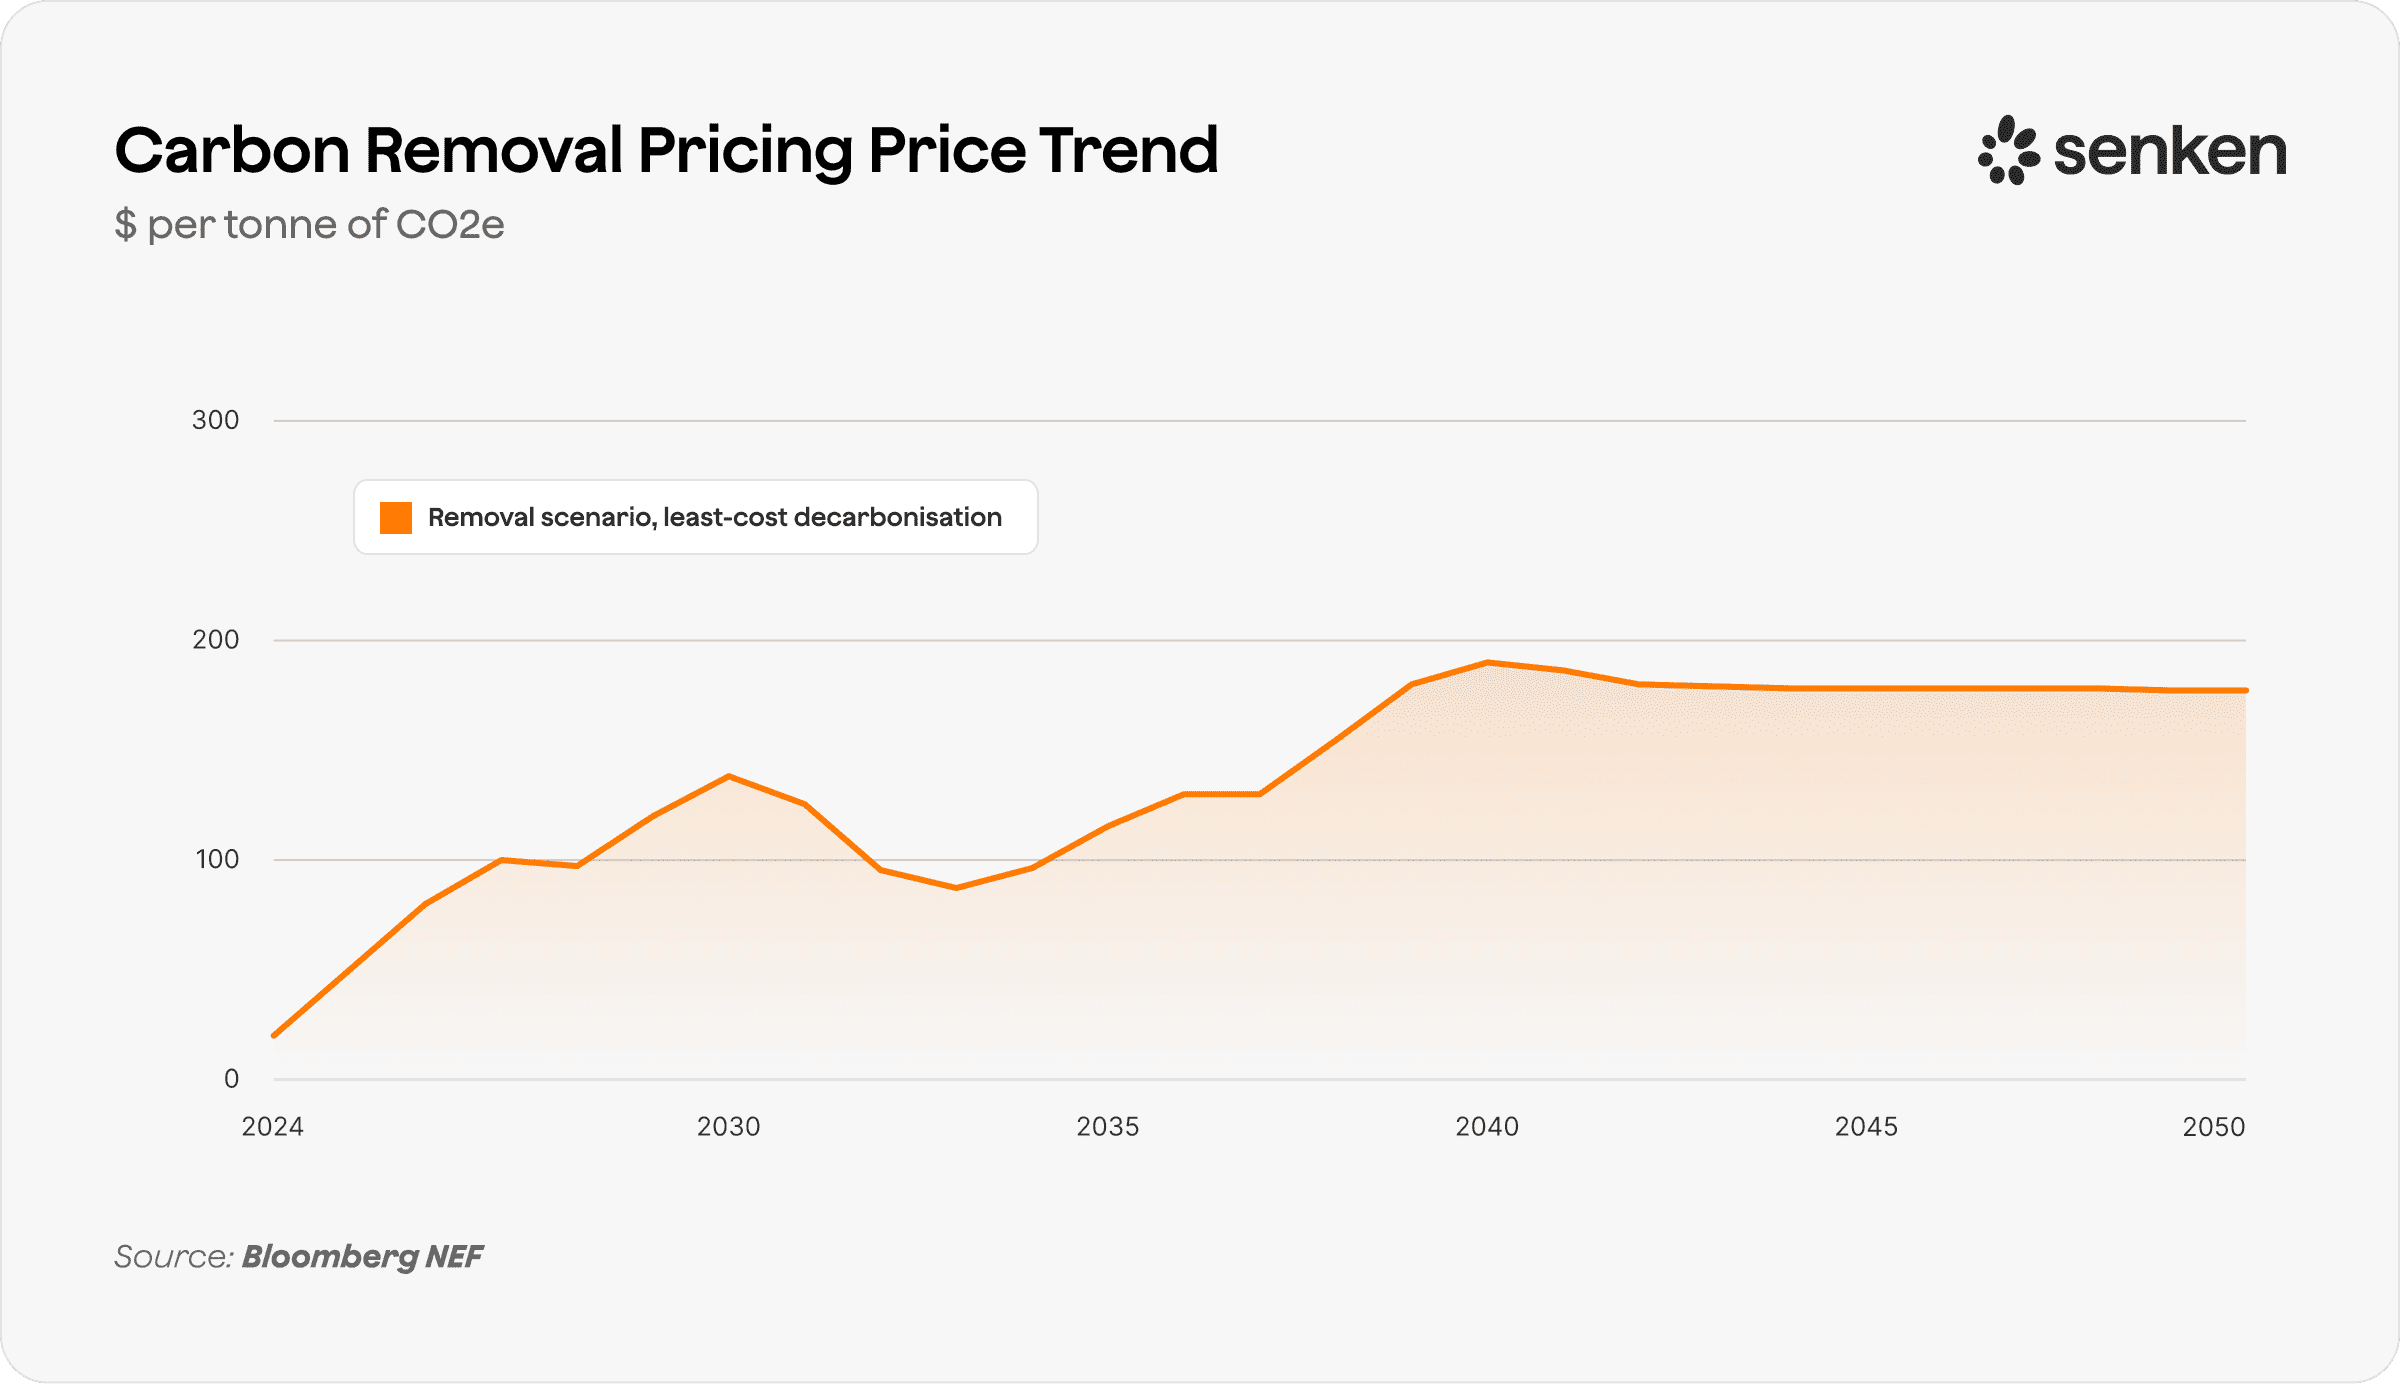
Standard terms are usually 15% deposit at signing and 85% payment on delivery. However we are also seeing full payment-on-delivery structures available at a small premium.
The important part is this:
An offtake locks two things: price and supply.
You can wait. But neither of those things gets easier later.
Four ways to buy
We compared four ways the buyer could meet the same long-term obligation, all priced against the BNEF Removal curve.
A. Buy spot every year from 2027 to 2045
Buy annually, with no forward commitment.
Total volume: 950 kt
Nominal cost: around €131M
A2. Lock in €71/t for the full ladder from 2027 to 2045
Sign the offtake today and cover every year.
Total volume: 950 kt
Nominal cost: around €67M
B. Wait and buy spot from 2035 to 2045
Buy nothing now, then pay spot from the regulatory cliff onward.
Total volume: 550 kt
Nominal cost: around €88M
B2. Lock in €71/t for 2035 to 2045
Sign the offtake today, but only for the regulated window.
Total volume: 550 kt
Nominal cost: around €39M
For an illustrative buyer at 50 kt per year, the headline savings are clear:
Full ladder:
A versus A2 saves about €63M nominal, or €21M NPV at 8% WACC.
Cliff-aligned only:
B versus B2 saves about €49M nominal, or €13M NPV at 8% WACC.
And by 2045, the spot price is 2.38x higher than the lock-in price.
The WACC sensitivity does not break the case
The first thing a CFO will push on is WACC.
So we ran the model at 4%, 6%, 8% and 10%.
The NPV saving narrows as WACC rises. That is expected. But the case never inverts.
At 4%, the saving on the full ladder grows to roughly €34M NPV.
At 10%, it still stays comfortably positive.
That matters because it removes the easiest objection.
There is no reasonable cost of capital in this model where the buyer is better off waiting. The price curve simply runs faster than the discount rate.
“But we only need credits from 2035”
This is the most common pushback we hear:
"We only need to compensate from 2035. Why would we sign now?"
Scenario B2 is built for exactly that question.
Same delivery years. Same 2035 to 2045 window. Same 550 kt volume.
The only difference is whether the buyer locks the price today at €71/t, or waits and pays market prices in the 2030s.
The result: about €49M saved nominally, or €13M NPV at 8% WACC.
So even the more conservative buyer, the one that only wants to cover the regulatory cliff, still comes out tens of millions ahead.
The price curve is doing the work.
And the curve is rising for a reason: supply scarcity. Microsoft alone holds 78.5% of contracted durable CDR. BECCS is roughly 95% pre-sold for 2030+ delivery. Audit-grade engineered removal is already heavily pre-sold for the back half of the 2030s.
By the time you arrive at the 2035 cliff, the queue ahead of you is already paid in.
What you can do with this
Our customers get the full model tomorrow.
They can change the price curve, plug in their own WACC, vary the volume profile by year, and see exactly where the savings come from.
For everyone else, we built a simple calculator.
Drop in your annual tonnage and delivery years, and it shows the lock-in saving across different WACC bands.
Bottom line
Today is the cheapest day.
The crossover is now. The curve runs to 2.38x by 2045. And a 50 kt per year buyer locking the full ladder saves about €63M nominal, or €21M NPV at 8% WACC.
Even cliff-aligned buyers, the ones who only need credits from 2035 onward, still save about €49M nominal, or €13M NPV.
Whatever WACC you use, the answer is the same:
Lock the price. Lock the supply. Pay on delivery.
Waiting is not neutral. It is a cost decision dressed up as a non-decision.
If you want me to walk you through the model using your numbers, just reply.
Chat soon,
Adrian
CEO & Co-Founder | Senken